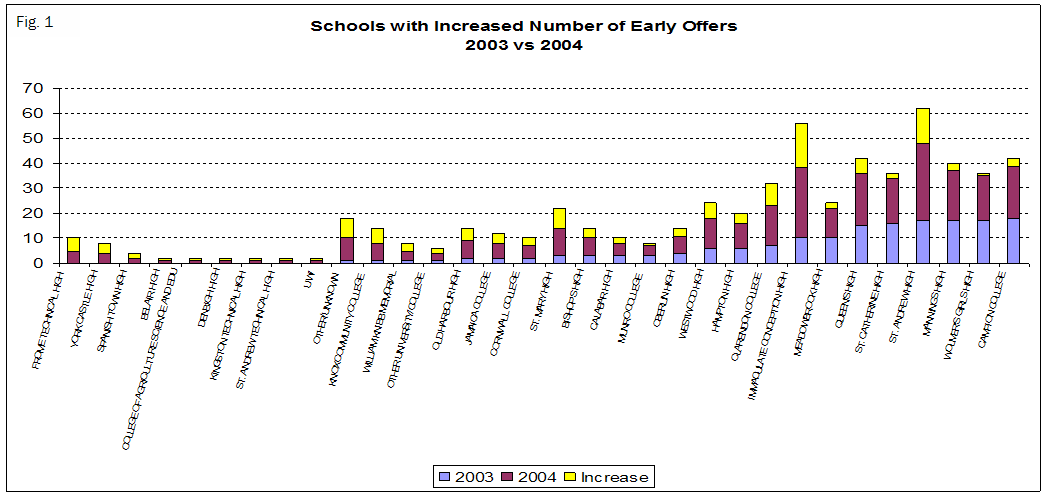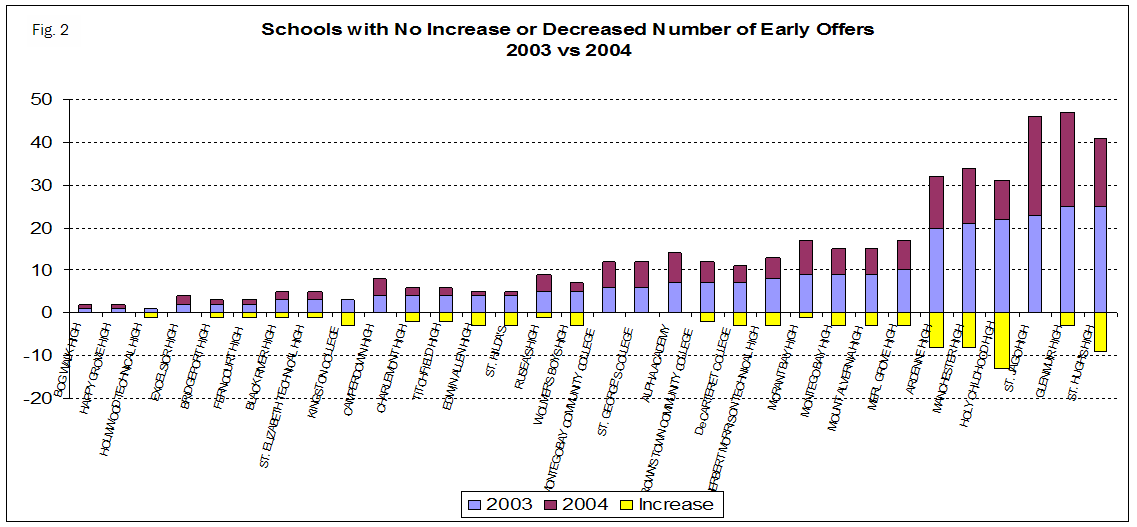
Table 1:
Change in Early Offers from 2003 to 2004, by School
|
SCHOOL
|
2003
OFFERS
|
2004
OFFERS
|
CHANGE
IN
# OFFERS
|
|
ALPHA
ACADEMY
|
7
|
7
|
0
|
|
ARDENNE
HIGH SCHOOL
|
20
|
12
|
-8
|
|
BELAIR HIGH SCHOOL
|
0
|
1
|
1
|
|
BISHOP'S
HIGH SCHOOL
|
3
|
7
|
4
|
|
BLACK
RIVER HIGH SCHOOL
|
3
|
2
|
-1
|
|
BOG WALK
HIGH SCHOOL
|
1
|
1
|
0
|
|
BRIDGEPORT
HIGH SCHOOL
|
2
|
1
|
-1
|
|
BROWN'S
TOWN COMMUNITY COLLEGE
|
7
|
5
|
-2
|
|
CALABAR
HIGH SCHOOL
|
3
|
5
|
2
|
|
CAMPERDOWN
HIGH SCHOOL
|
4
|
4
|
0
|
|
CAMPION
COLLEGE
|
18
|
21
|
3
|
|
CHARLEMONT
HIGH SCHOOL
|
4
|
2
|
-2
|
|
CLARENDON
COLLEGE
|
7
|
16
|
9
|
|
COLLEGE OF AGRICULTURE SCIENCE AND EDU
|
0
|
1
|
1
|
|
CORNWALL
COLLEGE
|
2
|
5
|
3
|
|
De CARTERET
COLLEGE
|
7
|
4
|
-3
|
|
DENBIGH HIGH SCHOOL
|
0
|
1
|
1
|
|
EDWIN
ALLEN HIGH SCHOOL
|
4
|
1
|
-3
|
|
EXCELSIOR
HIGH SCHOOL
|
2
|
2
|
0
|
|
FERNCOURT
HIGH SCHOOL
|
2
|
1
|
-1
|
|
FROME TECHNICAL HIGH SCHOOL
|
0
|
5
|
5
|
|
GLENMUIR
HIGH SCHOOL
|
25
|
22
|
-3
|
|
HAMPTON
HIGH SCHOOL
|
6
|
10
|
4
|
|
HAPPY
GROVE HIGH
|
1
|
1
|
0
|
|
HERBERT
MORRISON TECHNICAL HIGH SCHOOL
|
8
|
5
|
-3
|
|
HOLMWOOD
TECHNICAL HIGH SCHOOL
|
1
|
0
|
-1
|
|
HOLY
CHILDHOOD HIGH SCHOOL
|
22
|
9
|
-13
|
|
IMMACULATE
CONCEPTION HIGH SCHOOL
|
10
|
28
|
18
|
|
JAMAICA
COLLEGE
|
2
|
6
|
4
|
|
KINGSTON
COLLEGE
|
3
|
0
|
-3
|
|
KINGSTON TECHNICAL HIGH SCHOOL
|
0
|
1
|
1
|
|
KNOX
COMMUNITY COLLEGE
|
1
|
7
|
6
|
|
MANCHESTER
HIGH SCHOOL
|
21
|
13
|
-8
|
|
MANNINGS
HIGH SCHOOL
|
17
|
20
|
3
|
|
MEADOWBROOK
HIGH SCHOOL
|
10
|
12
|
2
|
|
MERL
GROVE HIGH SCHOOL
|
10
|
7
|
-3
|
|
MONTEGO
BAY COMMUNITY COLLEGE
|
6
|
6
|
0
|
|
MONTEGO
BAY HIGH SCHOOL
|
9
|
6
|
-3
|
|
MORANT
BAY HIGH SCHOOL
|
9
|
8
|
-1
|
|
MOUNT
ALVERNIA HIGH SCHOOL
|
9
|
6
|
-3
|
|
MUNRO
COLLEGE
|
3
|
4
|
1
|
|
OBERLIN
HIGH SCHOOL
|
4
|
7
|
3
|
|
OLD
HARBOUR HIGH SCHOOL
|
2
|
7
|
5
|
|
OTHER
UNIVERSITY/COLLEGE
|
1
|
3
|
2
|
|
OTHER/UNKNOWN
SCHOOL
|
1
|
9
|
8
|
|
QUEEN'S
HIGH SCHOOL
|
15
|
21
|
6
|
|
RUSEA'S
HIGH SCHOOL
|
5
|
4
|
-1
|
|
SPANISH TOWN HIGH SCHOOL
|
0
|
2
|
2
|
|
ST.
ANDREW HIGH SCHOOL
|
17
|
31
|
14
|
|
ST. ANDREW TECHNICAL HIGH SCHOOL
|
0
|
1
|
1
|
|
ST.
CATHERINE HIGH SCHOOL
|
16
|
18
|
2
|
|
ST.
ELIZABETH TECHNICAL HIGH SCHOOL
|
3
|
2
|
-1
|
|
ST.
GEORGE'S COLLEGE
|
6
|
6
|
0
|
|
ST.
HILDA'S
|
4
|
1
|
-3
|
|
ST.
HUGH'S HIGH SCHOOL
|
25
|
16
|
-9
|
|
ST. JAGO
HIGH SCHOOL
|
23
|
23
|
0
|
|
ST. MARY
HIGH SCHOOL
|
3
|
11
|
8
|
|
TITCHFIELD
HIGH SCHOOL
|
4
|
2
|
-2
|
|
UWI
|
0
|
1
|
1
|
|
WESTWOOD
HIGH SCHOOL
|
6
|
12
|
6
|
|
WILLIAM
KNIBB MEMORIAL
|
1
|
4
|
3
|
|
WOLMER'S
BOYS HIGH SCHOOL
|
5
|
2
|
-3
|
|
WOLMER'S
GIRLS HIGH SCHOOL
|
17
|
18
|
1
|
|
YORK CASTLE HIGH SCHOOL
|
0
|
4
|
4
|
|
Total
|
427
|
100
|
|
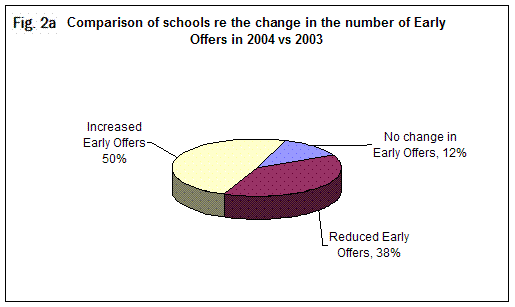
Table 2: UWI RATING BY TYPE OF OFFER AND YEAR
|
CATEGORY
|
ACAD_YEAR
|
Number of Students (N)
|
MEAN
RATING
|
Std. Dev.
|
|
Early Offer
|
2003
|
427
|
38.44
|
7.066
|
|
|
2004
|
480
|
40.79
|
9.368
|
|
|
Total
|
907
|
39.68
|
8.442
|
|
Regular Offer
|
2003
|
1200
|
34.35
|
10.716
|
|
|
2004
|
1132
|
35.08
|
10.830
|
|
|
Total
|
2332
|
34.70
|
10.775
|
|
Total
|
2003
|
1627
|
35.42
|
10.050
|
|
|
2004
|
1612
|
36.78
|
10.736
|
|
|
Total
|
3239
|
36.10
|
10.418
|
Fig. 3a
Histograms of the Number of Early Offers in 2003 vs 2004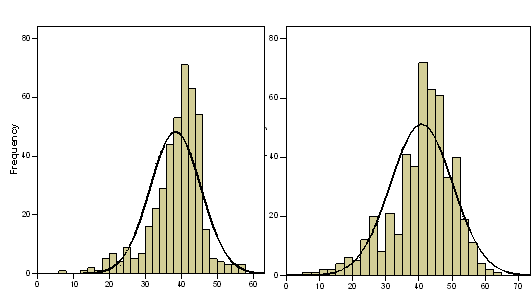
The average UWI rating of students who
received early offers in 2003 at 38.44 had a slight increase to 40.79 in
2004. However, with a minimum rating of
7 in both years, the maximum rating increased from 57 to 63, in part accounting
for a wider spread of scores. Note also,
that the standard deviation of the UWI rating in 2004 is higher than 2003,
though both seem to indicate a high level of focus in the rating scheme.
Fig. 3B Histograms of the Number of Regular Offers
in 2003 vs 2004
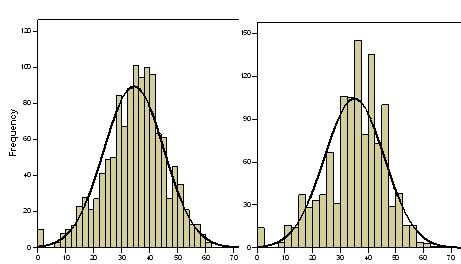
The average UWI rating of regular offers at
34.35 also had a slight increase to 35.08 in 2004. As expected, the spread of scores for regular
offers is wider and not as focused as for early offers.
While Fig. 3c indicates
that in both years, the average rating for regular offers was below that of
the early offers, Table 3 shows that the
minimum rating was 0 in both years and the maximum increased from 62 to 66.
More importantly, it shows that in both years some regular offers had
a higher UWI rating than some early offers.
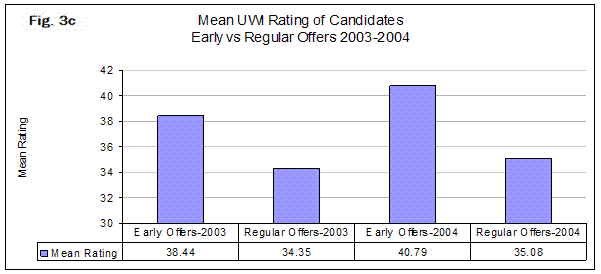
Table 3: Descriptive statistics for UWI Rating in
2003 and 2004
|
|
2003 UWI Rating- Early Offers
|
2003 UWI Rating – Regular Offers
|
2004 UWI Rating- Early Offers
|
2004 UWI Rating- Regular Offers
|
|
N
|
Valid
|
427
|
480
|
1200
|
1132
|
|
Mean
|
38.44
|
40.79
|
34.35
|
35.08
|
|
Median
|
40.00
|
42.00
|
35.00
|
36.00
|
|
Mode
|
40
|
44
|
40
|
34
|
|
Std. Deviation
|
7.066
|
9.368
|
10.716
|
10.830
|
|
Minimum
|
7
|
7
|
0
|
0
|
|
Maximum
|
57
|
63
|
62
|
66
|
|
|
|
|
|
|
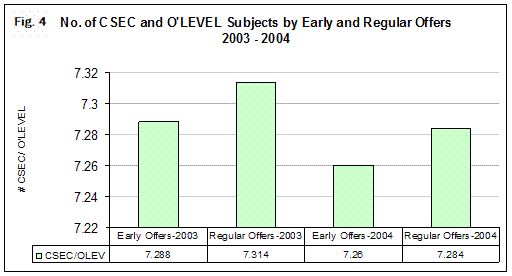
Fig. 4 and Fig. 5 show,
as expected, that the early offers generally had more A’Level and/or CAPE
subjects than the students who had regular offers, while the students with regular
offers tended to have more of the O’LEVELand/or CSEC subjects.
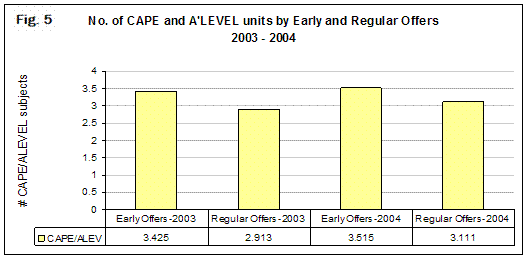
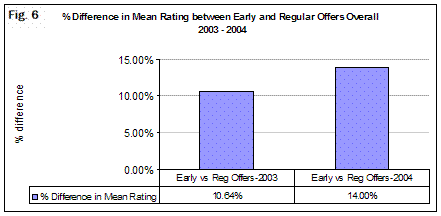
There was a widening
of the gap between early and regular offers from 2003 to 2004. The average percentage difference between the
early and regular offer in 2003 was 10.64%. This rose to 14% in 2004.
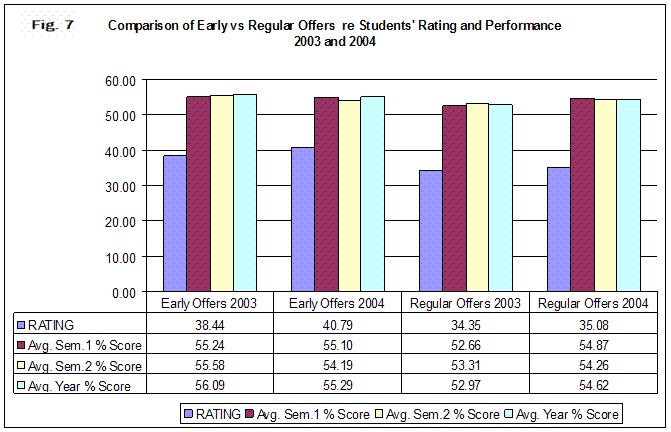
Fig.
7 looks at students’ average scores in Semester 1, Semester 2, and at the end
of their first year, by whether or not they had early offers, as well as their
average UWI rating on matriculation.
Fig.
7 shows, interestingly, that regardless of the UWI rating level (average shown
in blue for each group), there was no significant performance divergence among
the groups.
In
the overall average score for the year, there was a level of significance (Sig.
= 0.015) between the two years, ignoring the rating.
For the sample selected, students with early
offers did not generally out-perform those with regular offers. From Table 4, there is a maximum of 4.75
percentage points difference in performance in semester1, 3 points in semester
2, and 6.71 in the average for the year.
Table 4a: Descriptive Statistics for semester and
year-end scores in 2003
|
|
|
N
|
Mean
|
Std. Dev
|
Minimum
Score
|
Maximum
Score
|
|
Average Semester1
|
1
Early Offers
|
427
|
55.24
|
14.27
|
0.00
|
83.25
|
|
|
2
Regular Offers
|
1200
|
52.66
|
12.16
|
2.33
|
88.00
|
|
|
Total
|
1627
|
53.34
|
12.79
|
0.00
|
88.00
|
|
|
|
|
|
|
|
|
|
Average Semester2
|
1
Early Offers
|
427
|
55.58
|
15.29
|
0.00
|
92.00
|
|
|
2
Regular Offers
|
1200
|
53.31
|
14.52
|
0.00
|
95.00
|
|
|
Total
|
1627
|
53.91
|
14.75
|
0.00
|
95.00
|
|
|
|
|
|
|
|
|
|
Average Year
|
1
Early Offers
|
427
|
56.09
|
12.87
|
0.00
|
80.86
|
|
|
2
Regular Offers
|
1200
|
52.97
|
11.96
|
11.43
|
87.57
|
|
|
Total
|
1627
|
53.79
|
12.28
|
0.00
|
87.57
|
Table
4b: Descriptive Statistics for semester
and year-end scores in 2004
|
|
|
N
|
Mean
|
Std. Dev
|
Minimum
Score
|
Maximum
Score
|
|
Average
Semester1
|
1 Early Offers
|
480
|
55.10
|
14.23
|
0.00
|
89.00
|
|
|
2 Regular Offers
|
1132
|
54.87
|
12.48
|
7.00
|
94.33
|
|
|
Total
|
1612
|
54.94
|
13.02
|
0.00
|
94.33
|
|
|
|
|
|
|
|
|
|
Average
Semester2
|
1 Early Offers
|
480
|
54.19
|
15.42
|
0.00
|
87.00
|
|
|
2 Regular Offers
|
1132
|
54.26
|
13.31
|
0.00
|
90.67
|
|
|
Total
|
1612
|
54.24
|
13.97
|
0.00
|
90.67
|
|
|
|
|
|
|
|
|
|
Average
Year
|
1 Early Offers
|
480
|
55.29
|
12.33
|
0.00
|
87.43
|
|
|
2 Regular Offers
|
1132
|
54.62
|
11.63
|
13.63
|
92.50
|
|
|
Total
|
1612
|
54.82
|
11.85
|
0.00
|
92.50
|
Report submitted by Joan Leitch
.